Key Terms
Definitions of terms used throughout the documentation.
Basic Blocks
Section titled “Basic Blocks”A basic block is a sequence of instructions with no internal branches. Metalware measures coverage by counting the unique basic blocks the fuzzer reaches.
# ── Block 1 ──────────────────check:    lw    $t0, 0($a0)    beq   $t0, $zero, skip   # branch ends block
# ── Block 2 ──────────────────handle:    addi  $t0, $t0, 1    sw    $t0, 0($a0)
# ── Block 3 ──────────────────skip: jr $ra # return ends blockMemory-Mapped I/O (MMIO) is how firmware communicates with peripherals (UART, SPI, GPIO, etc) by reading and writing to specific memory addresses. See How It Works for how Metalware handles MMIO.
Direct Memory Access (DMA) allows peripherals to transfer data directly to RAM without CPU involvement. Metalware automatically detects and fuzzes DMA buffers.
An image is the firmware binary being tested. This can be an ELF, a raw binary, or a series of raw binaries.
Analysis
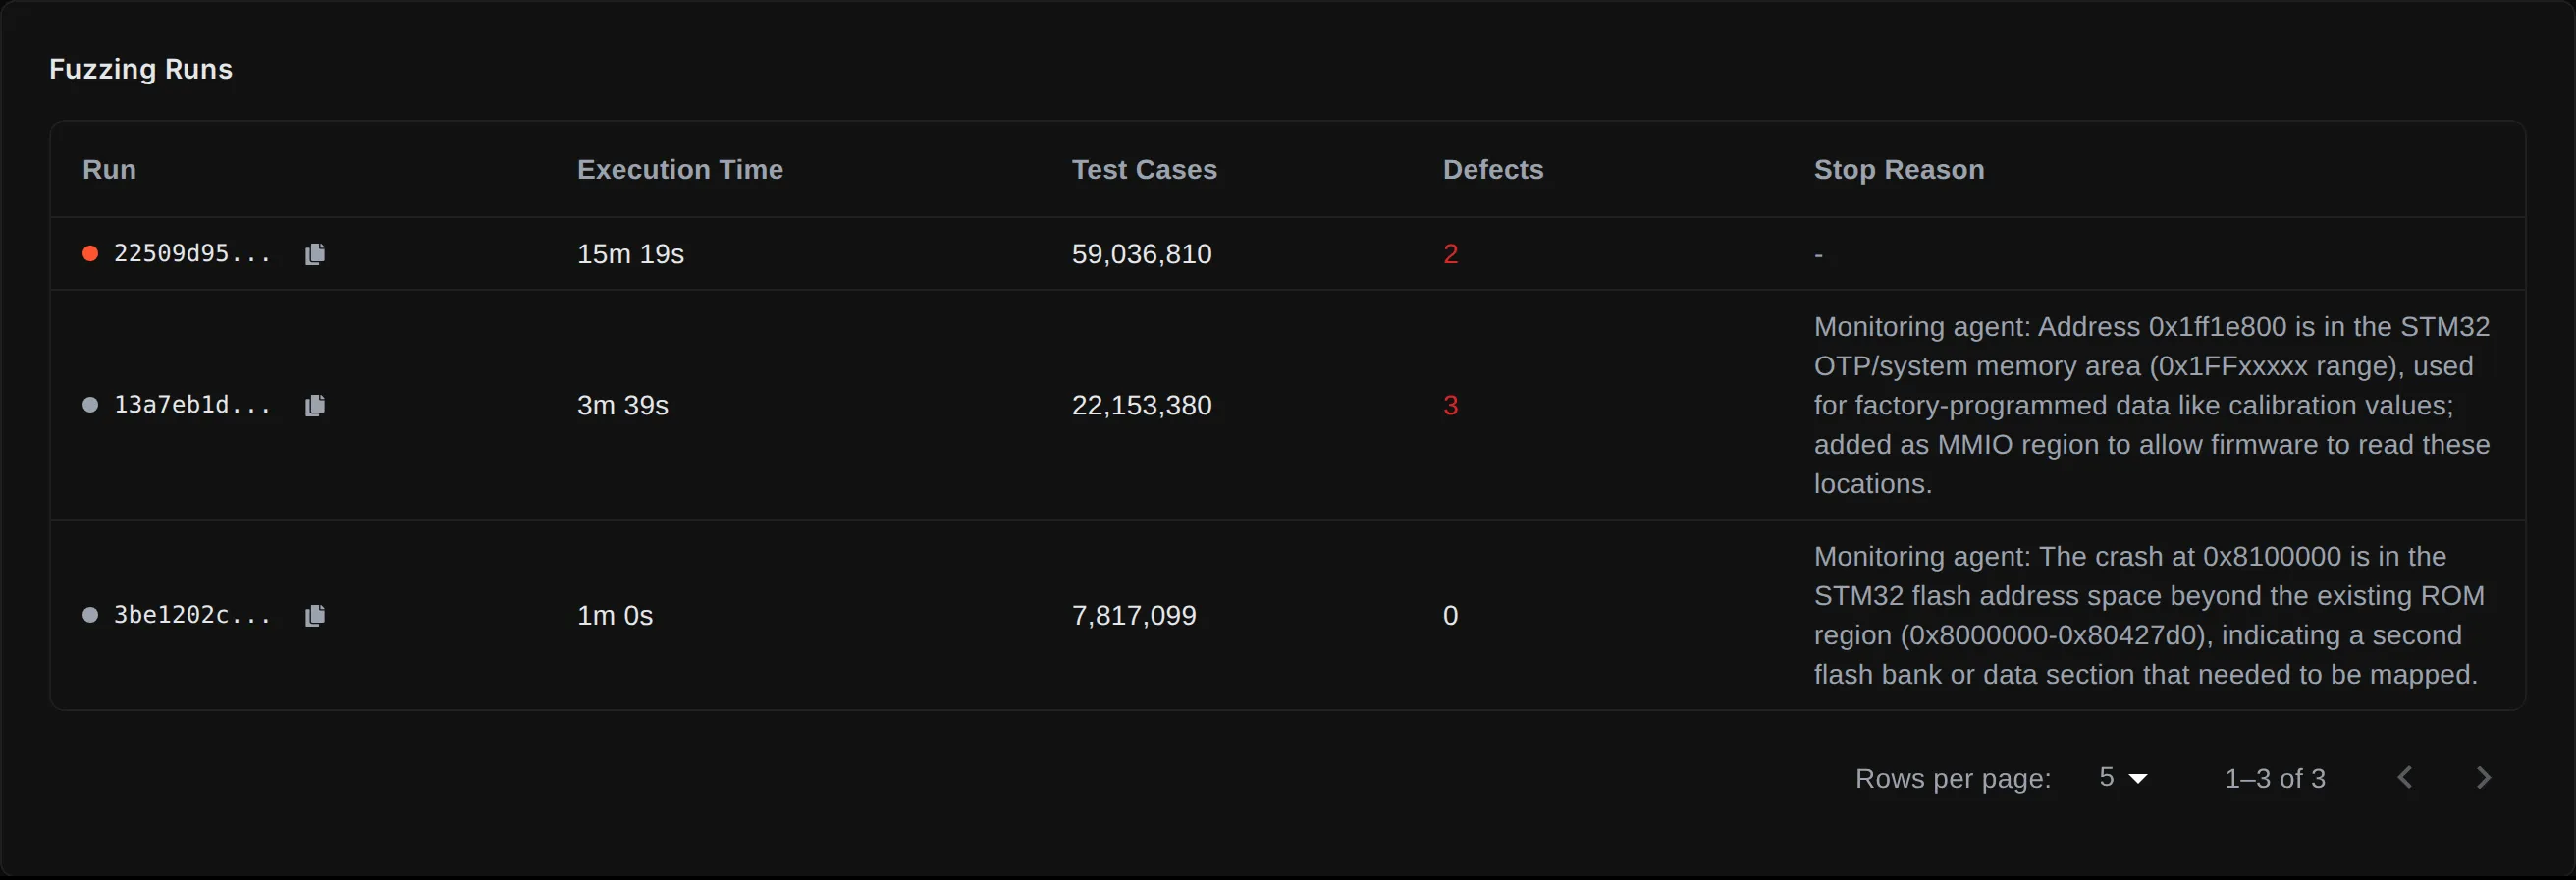
Section titled “Analysis”An analysis is a fuzzing session for an image. There may be multiple runs in an analysis.
A run is a single fuzzing execution within an analysis. Various settings, such as the memory map, are fixed for the duration of a run. As Metalware learns more about the image, it may launch new runs with updated settings.
Corpus
Section titled “Corpus”The corpus is the accumulated set of inputs that produce unique coverage. Metalware stores it on the server and associates it with tags, so subsequent analyses can pick up where previous ones left off.
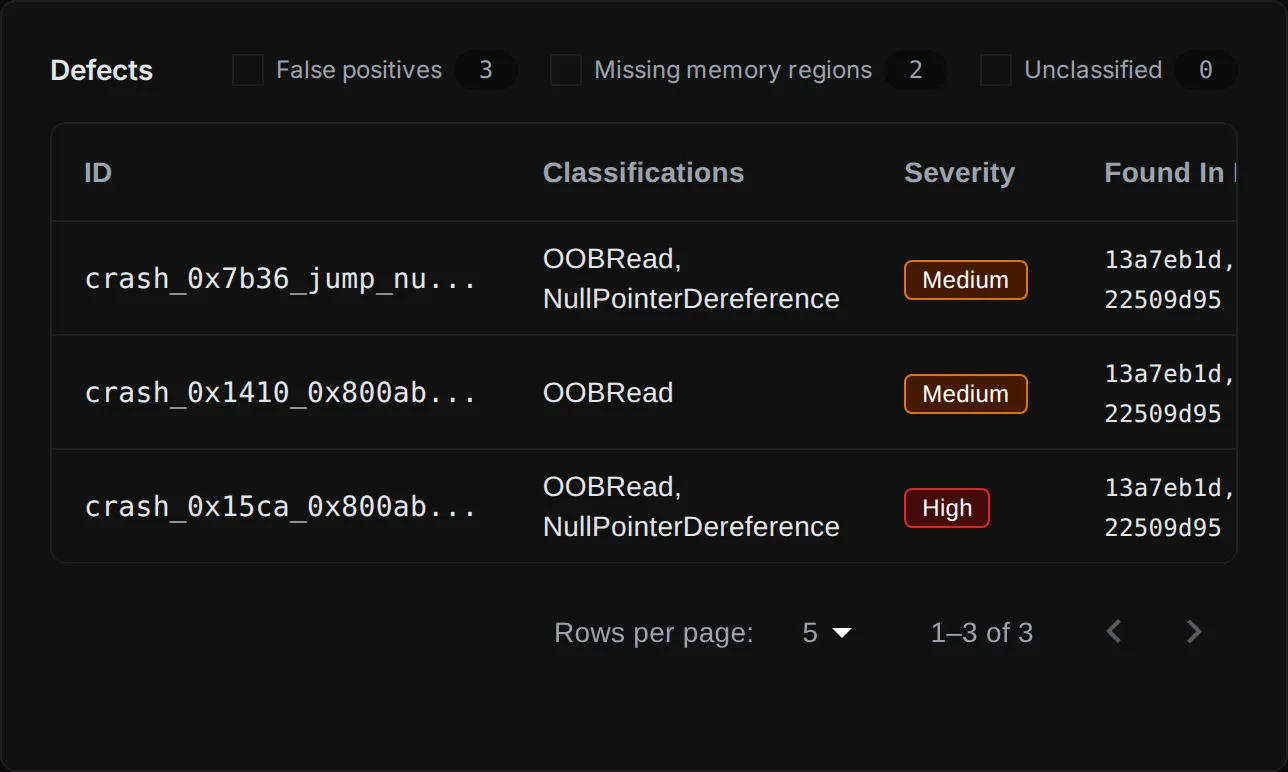
Defects
Section titled “Defects”A defect is a bug found during fuzzing. These are classified as: OOBWrite, OOBRead, NullPointerDereference, StackOverflow, Underflow, or UntrustedControlFlowTransfer. Each defect is assigned a severity rating.
Program Trace
Section titled “Program Trace”A program trace is a step-by-step recording of every instruction executed during a test case. Traces are downloadable from the defect detail view and can be replayed in the debugging tools.